Methodology and visualisation
One goal of the project was to visualize and analyse the competences in the transport sector, and thus be able to compare organizational and process structures cross-border. As a comprehensive ad-hoc mapping of all relevant structures and processes was way too complex, we used a two-stage approach.
In the first step common processes (e.g. planning and construction of a motorway) were recorded. The necessary information was gathered via online research and personal interviews with relevant stakeholders. These processes were visualized in a swimlane-chart, where separate process steps (or rather competences) are laid out on a horizontal axis in their chronological order, while they are vertically filed under the responsible organisations and departments (in so called “swimlanes”).

In the second step the previously identified departments with their competences structured according to their superior organisations – thus creating the “competence map”.
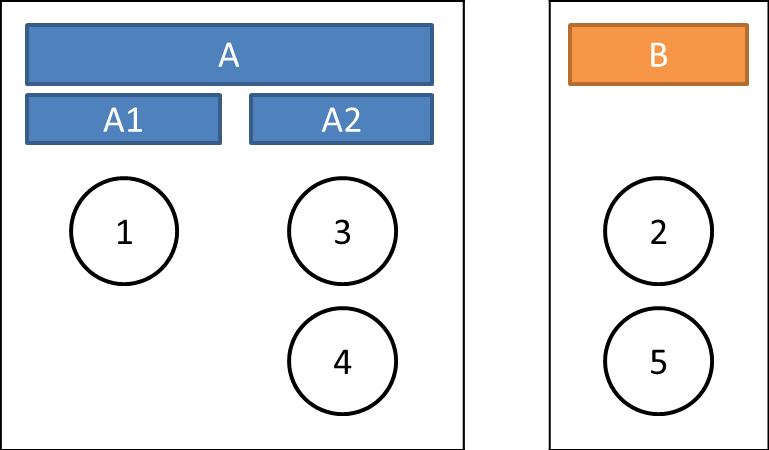
As the competences were color-coded (according to the processes) in their hierarchies and responsibilities (federal government, regional government, local government, other) a cross-border comparison is possible at a quick glance.
A technical summary of the methodology can be downloaded here.
Swimlane Charts and Competence Maps
All of the Swimlane Charts and Competence Maps can be downloaded below as PDFs.
Legend
Swimlane Charts – AT
- Verkehrskonzept / Transport Concept
- Autobahnen und Schnellstrassen / Highway and Speedways
- Bundesstrassen und Landstrassen / Regional Roads
- Gemeindestrassen / Local Roads
- Bahnbau – Hauptbahnen / Construction of Main Railways
- Bahnbau – Nebenbahnen / Construction of Secondary Railways
- Bahnbetrieb / Railway operation (passenger trains)
Swimlane Charts – SK
- Transport Concept
- Highway
- Speedway
- Regional Roads
- Local Roads
- Railway Construction
- Railway Operation